Navigation
Table of Contents
Vol. 25
Issue 1
Results:
Public Agency Parcel Data Survey
DCHP
GIS Net Surfing
News to Use
Tell A Friend
Send change of address to:
Charlow@ charter.net

|

Volume 24 • No 9 • 2001
ISSN 0742-468X • Since 1978
On-line Since 2000
Results:
Public Agency Parcel Data Survey
You may remember that two issues back we told you that we were conducting a nationwide survey of the state of public agency parcel data. We wanted to know how complete it was, what format it was in, was it available to the public, and so forth. The survey may be viewed at http://www.theharlowreport.com/survey/ for those of you who want to see the specific questions
We extend our thanks to all of you who took the time to respond. With one notable exception you were glad to help and responded with the information we needed. Surprisingly, one major public agency did not feel it needed to tell the public what their policy was on the use of this public data. Thinking this was just a snub from a low-level employee, I wrote to the senior executive of the project to ask her if I had somehow offended someone, or was this really their policy? As you might expect, I have not received a response.
Why the rant? Too often public servants forget that they are servants of the public and think they are kings and queens. It is reassuring to know that in the local government GIS community, the spirit of the public good was alive and well. One bad apple doesn't always spoil the barrel. Sometimes it reminds us of all the good apples. So, again to all of you who responded, a heartfelt thanks goes out to you.
The Methods and Results
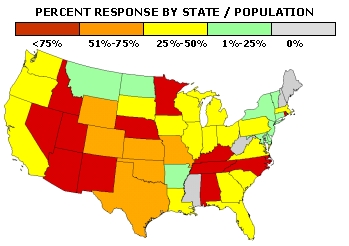 We established E-mail addresses for 230 jurisdictions by calling each of the 265 tax map jurisdictions located within the 140 major metros of the United States. We sent each an e-mail requesting that they complete the survey. Of these, 140 responded. States with the highest percentage of jurisdictions responding are red. Low response states are green and the gray states are those for which there were no responses to our questionnaire. In those states with low response rates, the reliability of all other responses are of constrained reliability.
Some responses were not complete. For this reason, in some of the subsequent maps, you will see some zero response states not because they failed to respond to the questionnaire but no one in that state provided a response to the question in point.
We established E-mail addresses for 230 jurisdictions by calling each of the 265 tax map jurisdictions located within the 140 major metros of the United States. We sent each an e-mail requesting that they complete the survey. Of these, 140 responded. States with the highest percentage of jurisdictions responding are red. Low response states are green and the gray states are those for which there were no responses to our questionnaire. In those states with low response rates, the reliability of all other responses are of constrained reliability.
Some responses were not complete. For this reason, in some of the subsequent maps, you will see some zero response states not because they failed to respond to the questionnaire but no one in that state provided a response to the question in point.
|
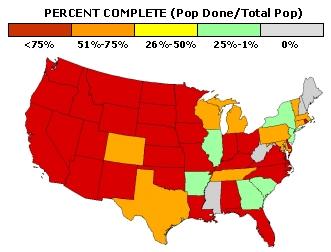 Percent complete was determined by multiplying the percent
complete of each reporting jurisdiction by its population.
The sum of all these values were compared with the total
population of all major metro jurisdictions in the state. Many major metro jurisdictions in the Western states are over 75% complete with their digital cadastral map databases
along with many mid-Atlantic states. Weakest performance is in
the Northeast Corridor and portions of the South.
Percent complete was determined by multiplying the percent
complete of each reporting jurisdiction by its population.
The sum of all these values were compared with the total
population of all major metro jurisdictions in the state. Many major metro jurisdictions in the Western states are over 75% complete with their digital cadastral map databases
along with many mid-Atlantic states. Weakest performance is in
the Northeast Corridor and portions of the South.
|
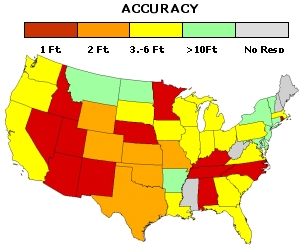 In about a fourth of the states, major metro jurisdictions
reported accuracy levels in their best mapped areas
of less than 1 foot. A fourth of the states reported
accuracy of less than 2 feet The rest of the reporting
states claimed 3-6 feet with only a few reporting
lower accuracy rates of 10 feet or more.
NOTE: All ratings represent the most frequently
reported response by each jurisdiction in the state
In about a fourth of the states, major metro jurisdictions
reported accuracy levels in their best mapped areas
of less than 1 foot. A fourth of the states reported
accuracy of less than 2 feet The rest of the reporting
states claimed 3-6 feet with only a few reporting
lower accuracy rates of 10 feet or more.
NOTE: All ratings represent the most frequently
reported response by each jurisdiction in the state
|
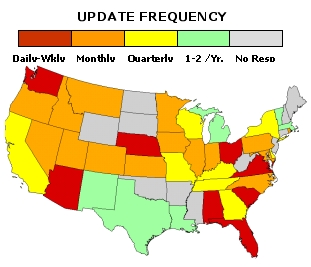 This response indicates how rapidly a new lot split, join or new
subdivision is added to a jurisdiction-wide GIS map.
Jurisdictions in a few states generally reported, with exceptions,
daily updates. Most other report weekly to monthly updates.
However, interviews with some of these respondents indicated
that these updates were for in-house use only and that
the master GIS database shared with the general public were
typically updated quarterly. A few states have a policy of updating their map on a semi-annually to annual basis only. Some states are in this category due to some of their jurisdictions, where deferred maintenance, has put them more than a year behind. Check before you use!
NOTE: All ratings represent the most frequently
Reported response by each jurisdiction in the state.
This response indicates how rapidly a new lot split, join or new
subdivision is added to a jurisdiction-wide GIS map.
Jurisdictions in a few states generally reported, with exceptions,
daily updates. Most other report weekly to monthly updates.
However, interviews with some of these respondents indicated
that these updates were for in-house use only and that
the master GIS database shared with the general public were
typically updated quarterly. A few states have a policy of updating their map on a semi-annually to annual basis only. Some states are in this category due to some of their jurisdictions, where deferred maintenance, has put them more than a year behind. Check before you use!
NOTE: All ratings represent the most frequently
Reported response by each jurisdiction in the state.
|
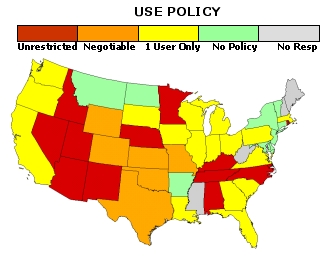 The majority of jurisdictions in many states are releasing their GIS databases to the public unconstrained. Acquired databases can be shared with other users without reporting it to the sponsoring agency. Interviews indicated that this policy is in response to a growing opinion that it is more in the “public interest ” that the data is “just used ” than to try to recoup expenses through cost-recovery. Increases to the tax base and environmental responsiveness that flow from just one development project realizing greater quality through unconstrained use of parcel-level data can easily dwarf all revenues realized from multiple years cost-recovery. Also, a no constraint policy eliminates substantial administrative costs of marketing, selling and monitory use of the data.
NOTE:Some jurisdictions in many states do not yet have a use policy in place. However, the dominate practice is what is reported here.
The majority of jurisdictions in many states are releasing their GIS databases to the public unconstrained. Acquired databases can be shared with other users without reporting it to the sponsoring agency. Interviews indicated that this policy is in response to a growing opinion that it is more in the “public interest ” that the data is “just used ” than to try to recoup expenses through cost-recovery. Increases to the tax base and environmental responsiveness that flow from just one development project realizing greater quality through unconstrained use of parcel-level data can easily dwarf all revenues realized from multiple years cost-recovery. Also, a no constraint policy eliminates substantial administrative costs of marketing, selling and monitory use of the data.
NOTE:Some jurisdictions in many states do not yet have a use policy in place. However, the dominate practice is what is reported here.
|
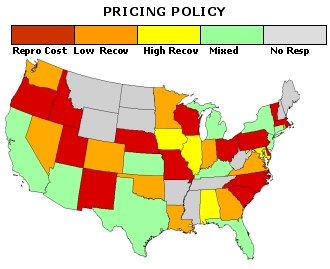 This is the most disjointed result. Data pricing policies often range from free to excessively expensive in a single state. Based on limited interviews, most jurisdictions committed to high cost-recovery prices started their GIS years ago, spent millions on it and are now digging in their heels to try to get their money back. On the other hand, many jurisdictions charging cost-of-reproduction prices (free ftp downloads to less than $300) produced their GIS recently. The GIS of many of these jurisdictions is of higher accuracy and cartographic quality at a fraction of the price paid by those who started their maps long ago. Thanks to the most recent GPS, orthoproccessing and data entry technology combined with low bid prices of numerous skilled service companies, cost-of-reproduction GIS pricing to better serve the public interest comes easier to these jurisdictions having spent so much less to create their GIS.
NOTE: All ratings represent the most frequently reported response by each jurisdiction in the state.
This is the most disjointed result. Data pricing policies often range from free to excessively expensive in a single state. Based on limited interviews, most jurisdictions committed to high cost-recovery prices started their GIS years ago, spent millions on it and are now digging in their heels to try to get their money back. On the other hand, many jurisdictions charging cost-of-reproduction prices (free ftp downloads to less than $300) produced their GIS recently. The GIS of many of these jurisdictions is of higher accuracy and cartographic quality at a fraction of the price paid by those who started their maps long ago. Thanks to the most recent GPS, orthoproccessing and data entry technology combined with low bid prices of numerous skilled service companies, cost-of-reproduction GIS pricing to better serve the public interest comes easier to these jurisdictions having spent so much less to create their GIS.
NOTE: All ratings represent the most frequently reported response by each jurisdiction in the state.
|


Back to Top
All contents copyright ©2001
The Advanced Information Management Group, Inc.
| 